What Is a Moving Average? A Beginner’s Guide
Introduction
If you’re just getting started in trading or technical analysis, the term “moving average” might pop up often. It’s one of the most widely used tools in technical trading—and for good reason. A moving average helps smooth out price data, so you can identify trends more easily without getting distracted by short-term market fluctuations.
In this guide, we’ll break down exactly what a moving average is, how it works, why it’s used, and the different types traders rely on across various financial markets like stocks, crypto, forex, and ETFs.
What Is a Moving Average?
A moving average (MA) is a statistical calculation that helps you analyze price trends by averaging past prices over a defined time period. Instead of focusing on the latest price alone, a moving average shows how the price has been behaving over time.
For example:
- A 10-day moving average adds up the last 10 closing prices and divides the total by 10.
- This value is recalculated every day, “moving” as new data comes in.
Why Use a Moving Average?
Moving averages are used to:
- Identify trend direction – Is the market trending up, down, or moving sideways?
- Spot trend reversals – When price crosses above or below an MA, it can signal a change in direction.
- Smooth out price action – Reduces short-term fluctuations and noise.
- Support resistance levels – Many traders use MAs as dynamic support or resistance lines.
Types of Moving Averages
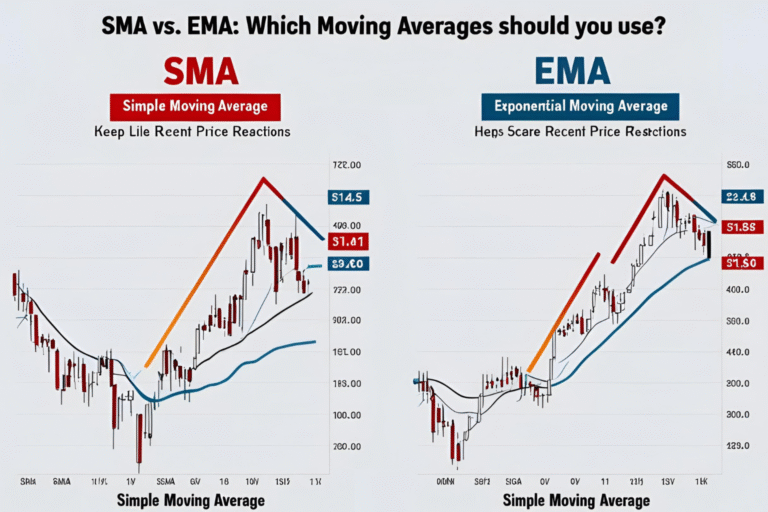
1. Simple Moving Average (SMA)
The Simple Moving Average gives equal weight to all data points over the selected period.
Example: A 50-day SMA on a stock chart will show the average price of the past 50 days, plotted daily.
2. Exponential Moving Average (EMA)
The Exponential Moving Average gives more weight to recent prices, making it more responsive to current market action.
Used for: Short-term trading, crypto, and forex markets where quick response to price changes is key.
3. Weighted Moving Average (WMA)
The Weighted Moving Average also emphasizes recent prices, but in a linear fashion. It’s less common but used in algorithmic or advanced trading models.
Common Moving Average Timeframes
- Short-Term: 9-day, 10-day, 20-day
- Medium-Term: 50-day, 100-day
- Long-Term: 200-day
Each timeframe suits different styles of trading:
- Day traders use short-term MAs.
- Swing traders often prefer 20-day to 50-day MAs.
- Long-term investors rely on 100-day or 200-day MAs.
Example: Moving Averages in Action
Let’s say the stock price of Apple (AAPL) has been gradually increasing over 50 days. A 50-day SMA will reflect this steady upward trend. If the price suddenly drops below the SMA line, traders may interpret it as a potential trend reversal.
Limitations of Moving Averages
- Lagging Indicator: MAs are based on past data, so they respond slowly to sudden market changes.
- False Signals: In sideways markets, MAs can give misleading buy/sell signals.
- Best used with: Other indicators like RSI, MACD, or volume analysis for confirmation.
Summary
A moving average is a foundational tool in technical analysis that helps traders and investors identify trends, spot reversals, and make more informed decisions. Whether you’re trading stocks, crypto, or forex, understanding how moving averages work is essential for building a solid trading strategy.
FAQs
What is a simple moving average in trading?
A simple moving average calculates the average price over a defined number of periods, giving equal weight to each.
Which is better, SMA or EMA?
SMA is better for long-term trend analysis; EMA is more responsive and suited for short-term strategies.
How do I choose the right moving average length?
Shorter periods (e.g. 10-day) are good for fast trades; longer ones (e.g. 200-day) are used to spot major trends.
Do moving averages work in crypto and forex?
Yes, moving averages are widely used in crypto and forex to identify trends and potential entry or exit points.
Can I use multiple moving averages together?
Yes, using a combination (e.g. 50-day and 200-day) helps spot crossovers and confirm trends.