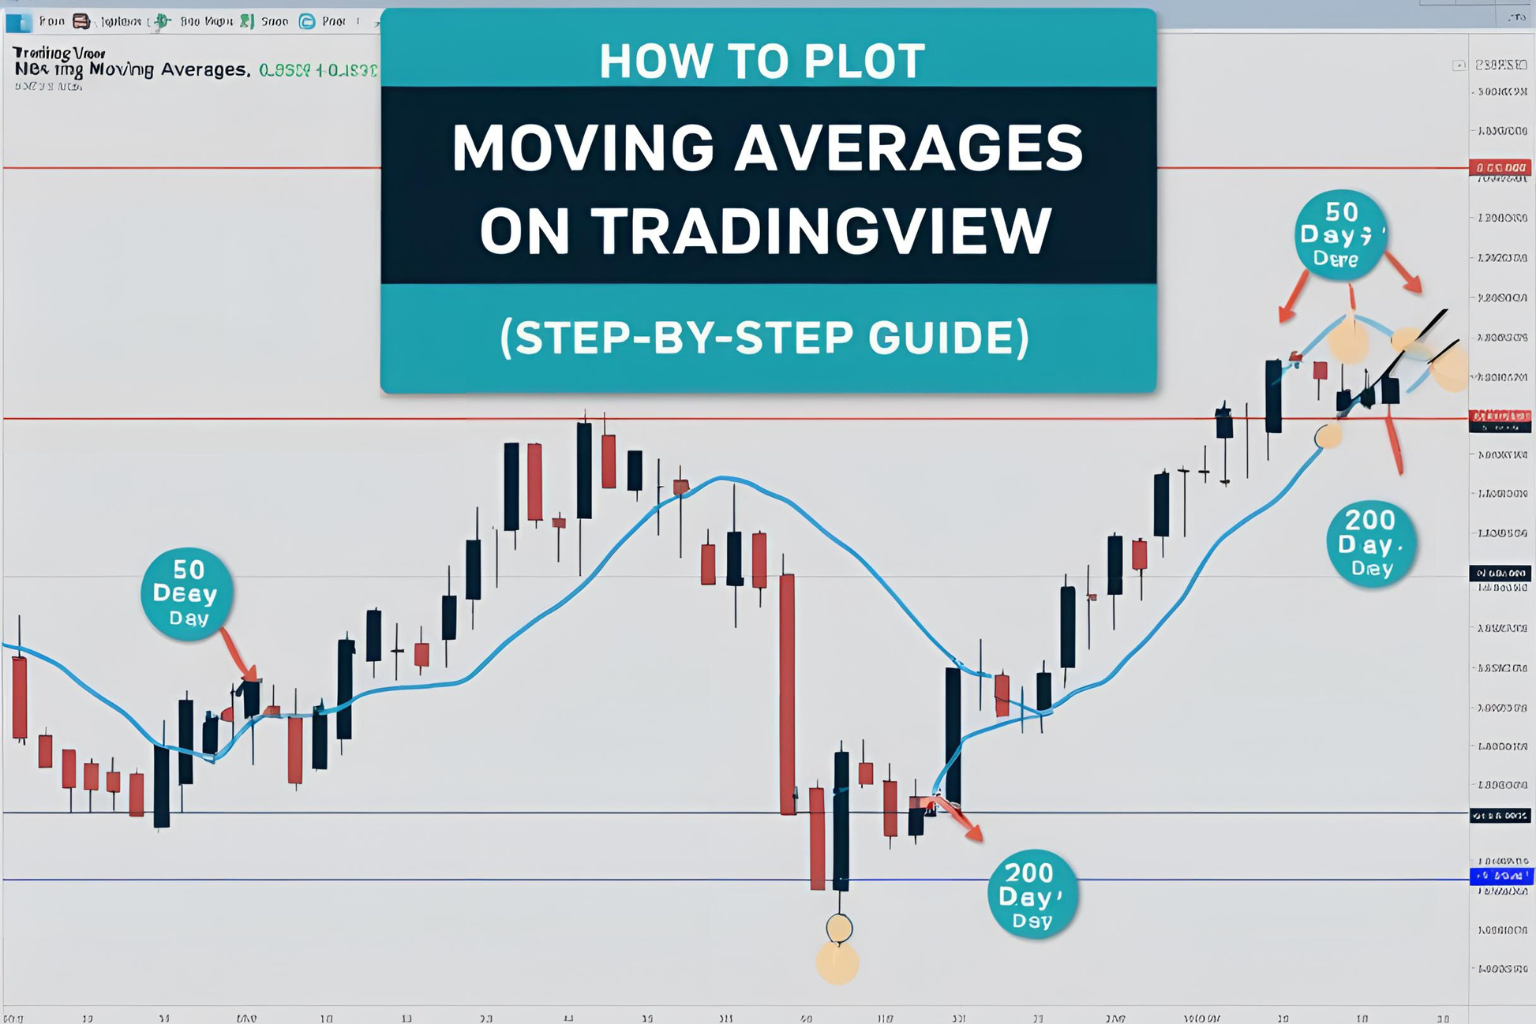
How to Plot Moving Averages on TradingView (Step-by-Step Guide)
Introduction
If you’re new to charting or just switching platforms, you’ll find TradingView to be one of the most user-friendly tools available. It allows traders to add and customize various indicators—including moving averages—in just a few clicks.
This tutorial will show you exactly how to plot moving averages on TradingView, choose between SMA and EMA, and tweak the settings to suit your strategy.
Step 1: Open a Chart on TradingView
- Go to www.tradingview.com
- Click “Chart” from the top menu
- Search and open any asset (e.g., BTC/USD, EUR/USD, AAPL)
You’ll see a clean, interactive chart where you can begin adding indicators.
Step 2: Add a Moving Average
- Click the “Indicators” icon (top toolbar, looks like a bar chart)
- In the search box, type “Moving Average”
- Select “Moving Average” (for SMA) or “Moving Average Exponential” (for EMA)
The indicator will appear on your chart with a default period (usually 9 or 14).
Step 3: Customize the Moving Average
To change the settings:
- Hover over the MA line and click the gear icon
- In the “Inputs” tab:
- Set your Length (e.g., 20, 50, or 200)
- Change the Source (close, open, high, low – usually “Close” is used)
- In the “Style” tab:
- Adjust the color, thickness, and line type for clarity
Click “OK” to apply your changes.
Step 4: Add Multiple Moving Averages
You can layer several moving averages on one chart for crossover or trend strategies:
- Add a 9 EMA and 21 EMA for short-term signals
- Use 50 SMA and 200 SMA for long-term trend tracking
Repeat the “Add Indicator” steps for each one.
Step 5: Save the Layout
- Click the “Save” icon at the top right
- Name your chart layout (e.g., “Moving Average Strategy”)
- Now, your setup will be saved across devices if you log in
You can even create different layouts for day trading, swing trading, or crypto analysis.
Optional: Use MA-Based Scripts from the TradingView Community
In the “Indicators” window:
- Click on the “Community Scripts” tab
- Search for “multi MA,” “EMA ribbon,” or “MA crossover”
- Many advanced MA tools are available for free
Just make sure to read reviews and test any public script on a demo chart.
Summary
Learning how to plot moving averages on TradingView is a foundational skill for any technical trader. In just a few steps, you can add SMAs, EMAs, or custom scripts to your charts and begin analyzing trends with confidence.
With its flexible charting tools and massive indicator library, TradingView makes it easy to implement any moving average strategy—whether you’re trading stocks, crypto, or forex.
FAQs
What’s the default moving average on TradingView?
It’s usually a 9-period SMA, but you can change this easily in the settings.
How many MAs can I add on a free account?
Free users can add up to 3 indicators per chart. Paid plans allow more.
Can I use both EMA and SMA on the same chart?
Yes. You can overlay multiple types of moving averages with different periods.
Are custom MA scripts safe to use?
Most are safe, but always test community scripts on demo or non-critical charts.
Can I change moving averages per timeframe?
Yes. The MA will adjust to match the timeframe you’re viewing.