Moving Averages on SPY, QQQ, and DIA: A Technical Guide
Introduction
ETFs like SPY, QQQ, and DIA are among the most traded instruments in the U.S. stock market. These index-tracking funds represent the S&P 500, Nasdaq-100, and Dow Jones Industrial Average, respectively. For traders and investors alike, using moving averages on these ETFs provides clarity on market direction, timing, and structure.
In this guide, we’ll show how to apply and interpret moving averages on SPY, QQQ, and DIA effectively.
Why Moving Averages Matter for Index ETFs
SPY, QQQ, and DIA are:
- Highly liquid
- Widely followed by retail and institutional traders
- Often used as leading indicators for U.S. market health
Using moving averages on these ETFs helps identify:
- Bullish or bearish momentum
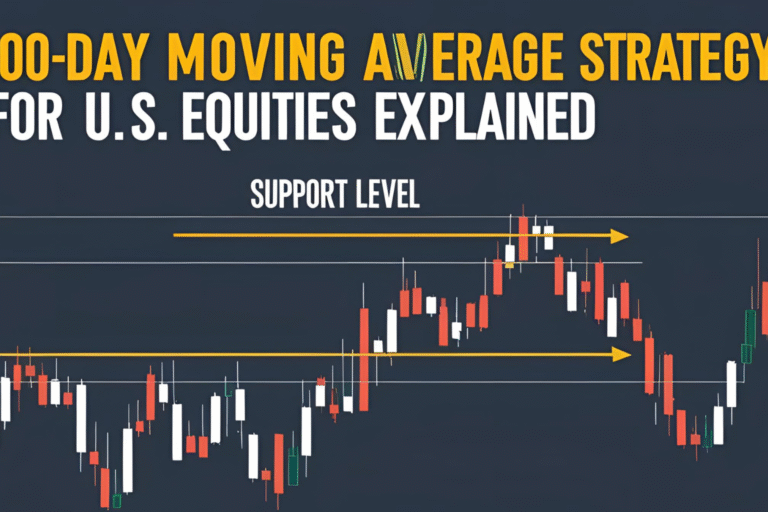
- Key support and resistance zones
- Entry and exit points for swing or position trades
Best Moving Averages for SPY, QQQ, and DIA
| Moving Average | Purpose |
|---|---|
| 20-day EMA | Short-term trend, intraday signals |
| 50-day SMA | Medium-term trend confirmation |
| 200-day SMA | Long-term trend direction & support |
Each of these moving averages helps you interpret different market phases.
SPY (S&P 500 ETF)
- Above 200-day SMA: Broad market is in a long-term uptrend
- Pullback to 50-day SMA: Often a buy opportunity during healthy bull runs
- Golden Cross (50 > 200): Bullish market-wide sentiment
- Death Cross (50 < 200): Risk-off or recession warning
Tip: SPY reacts well to 50-day SMA in strong uptrends. Many fund managers use this level to rebalance portfolios.
QQQ (Nasdaq-100 ETF)
- Volatile tech-heavy ETF, so use EMA (20, 9) for faster signals
- Price often overshoots then pulls back to the 20 EMA
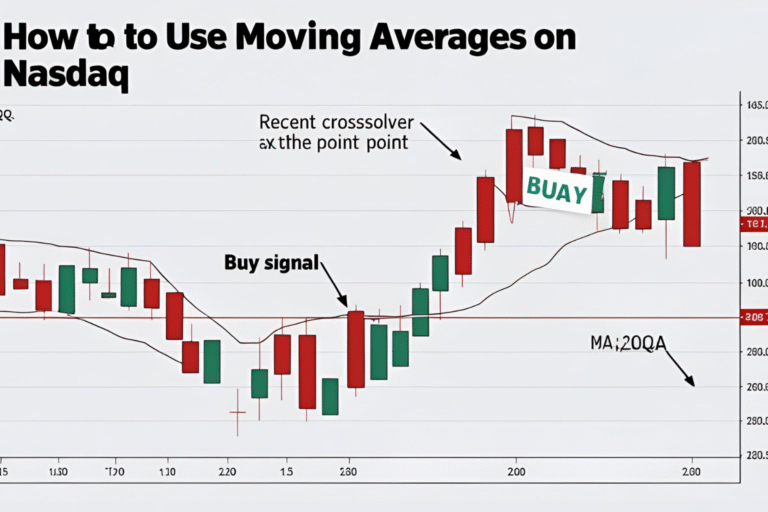
- Watch for bullish crossover on fast EMAs (9/20) on the daily chart
- In strong uptrends, QQQ bounces off 50 SMA consistently
Tip: Combine moving averages with RSI for better timing, as tech stocks move quickly.
DIA (Dow Jones ETF)
- More stable and less volatile than QQQ
- 200 SMA is a strong long-term reference level for DIA
- Break below the 200 SMA may suggest broader weakness in traditional industries
- 20-day EMA is less relevant here; focus more on 50 and 200 SMA
Tip: Use the 200-day MA as a market health indicator when trading cyclical or value sectors.
How to Trade Moving Average Setups on These ETFs
Breakout Strategy:
- Wait for price to close above the 50-day SMA with strong volume
- Confirm with RSI above 50 or bullish candle pattern
- Entry on next day’s open; stop-loss below MA
Pullback Strategy:
- In an uptrend, wait for price to pull back to the 20-day EMA or 50-day SMA
- Enter on bullish bounce or engulfing pattern
- Set stop-loss just below the average
Real Example: SPY in Bull Market
During the 2020–2021 bull run, SPY consistently held above its 50-day SMA. Short dips to this level provided low-risk entries for swing trades, while the 200-day SMA was untouched for over a year—highlighting strong market momentum.
Summary
Using moving averages on SPY, QQQ, and DIA is a proven way to monitor the U.S. market’s pulse. These ETFs respond predictably to key MAs, making them ideal for trend trading and ETF-based strategies.
Focus on the 50-day and 200-day SMA for trend direction, and use short-term EMAs for intraday setups, especially in QQQ.
FAQs
Which moving average is best for SPY?
The 50-day SMA is widely used and respected by institutional traders.
Can I day trade SPY or QQQ using moving averages?
Yes. Use 9 EMA and 20 EMA on 5-minute or 15-minute charts for intraday trades.
What’s the difference in how these ETFs respond to MAs?
QQQ is more volatile (better with EMAs), DIA is slower-moving (better with SMAs), SPY is balanced.
How often do Golden or Death Crosses occur?
Rarely—only during major market shifts. They’re significant long-term signals.
Are moving average strategies effective for ETF investing?
Yes, especially for timing entries, exits, and monitoring overall market strength.