How to Use Moving Averages on Nasdaq Stocks for Better Trades
Introduction
The Nasdaq stock market is home to some of the most traded and volatile technology stocks like Apple, Tesla, and Nvidia. To navigate these fast-moving equities, traders often rely on moving averages to identify trends, confirm breakouts, and make smarter entries and exits.
In this guide, you’ll learn how to use moving averages on Nasdaq stocks, which timeframes work best, and how to build trading setups around them.
Why Moving Averages Are Useful for Nasdaq Trading
Nasdaq stocks are known for:
- Strong trends
- Sharp pullbacks
- High trading volume
This makes moving averages ideal tools for:
- Tracking trend direction
- Finding support and resistance
- Timing momentum breakouts or pullback entries
Best Moving Averages for Nasdaq Stocks
The most commonly used MAs in Nasdaq trading are:
- 20-day EMA: Short-term trend and pullback zone
- 50-day SMA: Medium-term trend confirmation
- 200-day SMA: Institutional-level trend filter
These can be applied on both daily and intraday charts depending on your trading style.
Strategy Example: 20 EMA Pullback on Strong Uptrend
Setup:
- Choose a Nasdaq stock in a strong uptrend (e.g., NVDA or AMZN)
- Wait for the price to pull back toward the 20 EMA on the daily chart
- Look for a bullish candle near the EMA to confirm entry
- Place stop-loss just below the recent low
This strategy allows traders to enter in-trend with minimal risk.
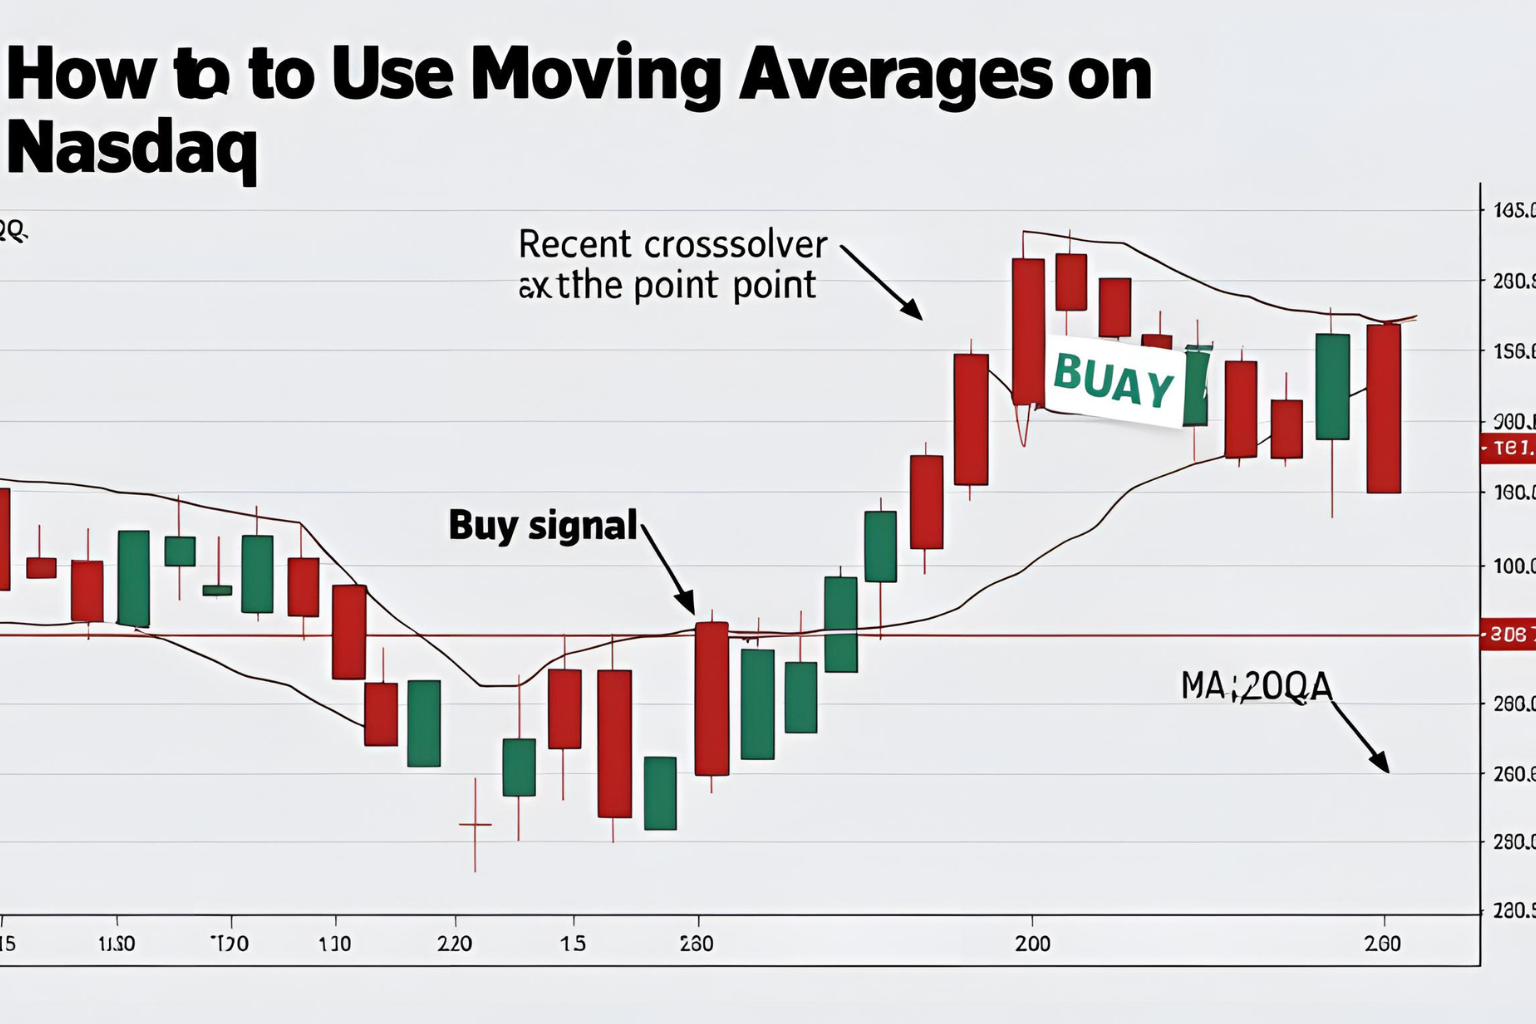
Strategy Example: 50-200 MA Crossover (Golden Cross)
When a 50-day SMA crosses above the 200-day SMA, it’s a bullish long-term signal—especially relevant for swing traders and position traders.
Look for:
- High volume during the crossover
- Uptrend continuation after breakout
- RSI confirmation above 50
Nasdaq stocks like MSFT, META, or AMD frequently trigger these setups during tech rallies.
Intraday Tip: 9 EMA and 20 EMA on 5-Min Chart
- Use the 9 EMA and 20 EMA on intraday Nasdaq stocks like TSLA
- Look for clean crossovers with volume spikes
- Confirm entries with price breaking above VWAP or intraday resistance
This is ideal for scalpers and day traders watching price momentum.
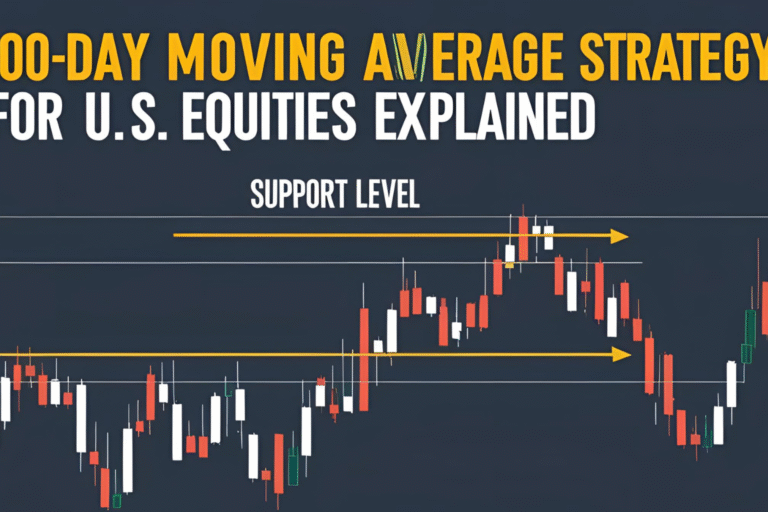
How Institutions Use MAs on Nasdaq Stocks
Large funds and hedge funds closely watch:
- 50-day and 200-day SMA levels for trend strength
- MA “holds” or “breakdowns” as decision points to enter or exit positions
- Golden Cross or Death Cross patterns to adjust portfolio weightings
As a retail trader, aligning your entries with these levels gives you an edge.
Summary
Using moving averages on Nasdaq stocks helps you filter trends, confirm setups, and avoid trading noise. Whether you’re trading short-term moves or long-term positions, MAs like the 20 EMA, 50 SMA, and 200 SMA offer powerful insights across all market conditions.
FAQs
What is the best moving average for trading Nasdaq stocks?
The 20 EMA is popular for short-term trends, while the 50 and 200 SMA are used for longer-term signals.
Do Nasdaq stocks respect technical levels like MAs?
Yes, especially high-volume stocks. Many traders and institutions monitor MA zones closely.
Can I use the same MA strategy across all Nasdaq stocks?
Yes, but always backtest or paper trade, as each stock has its own volatility profile.
How often should I check moving averages?
Daily charts for swing trades; intraday charts (5–15 min) for day trading setups.
Are moving averages better than indicators like MACD or RSI?
Not necessarily better, but combining MAs with RSI or MACD improves accuracy.