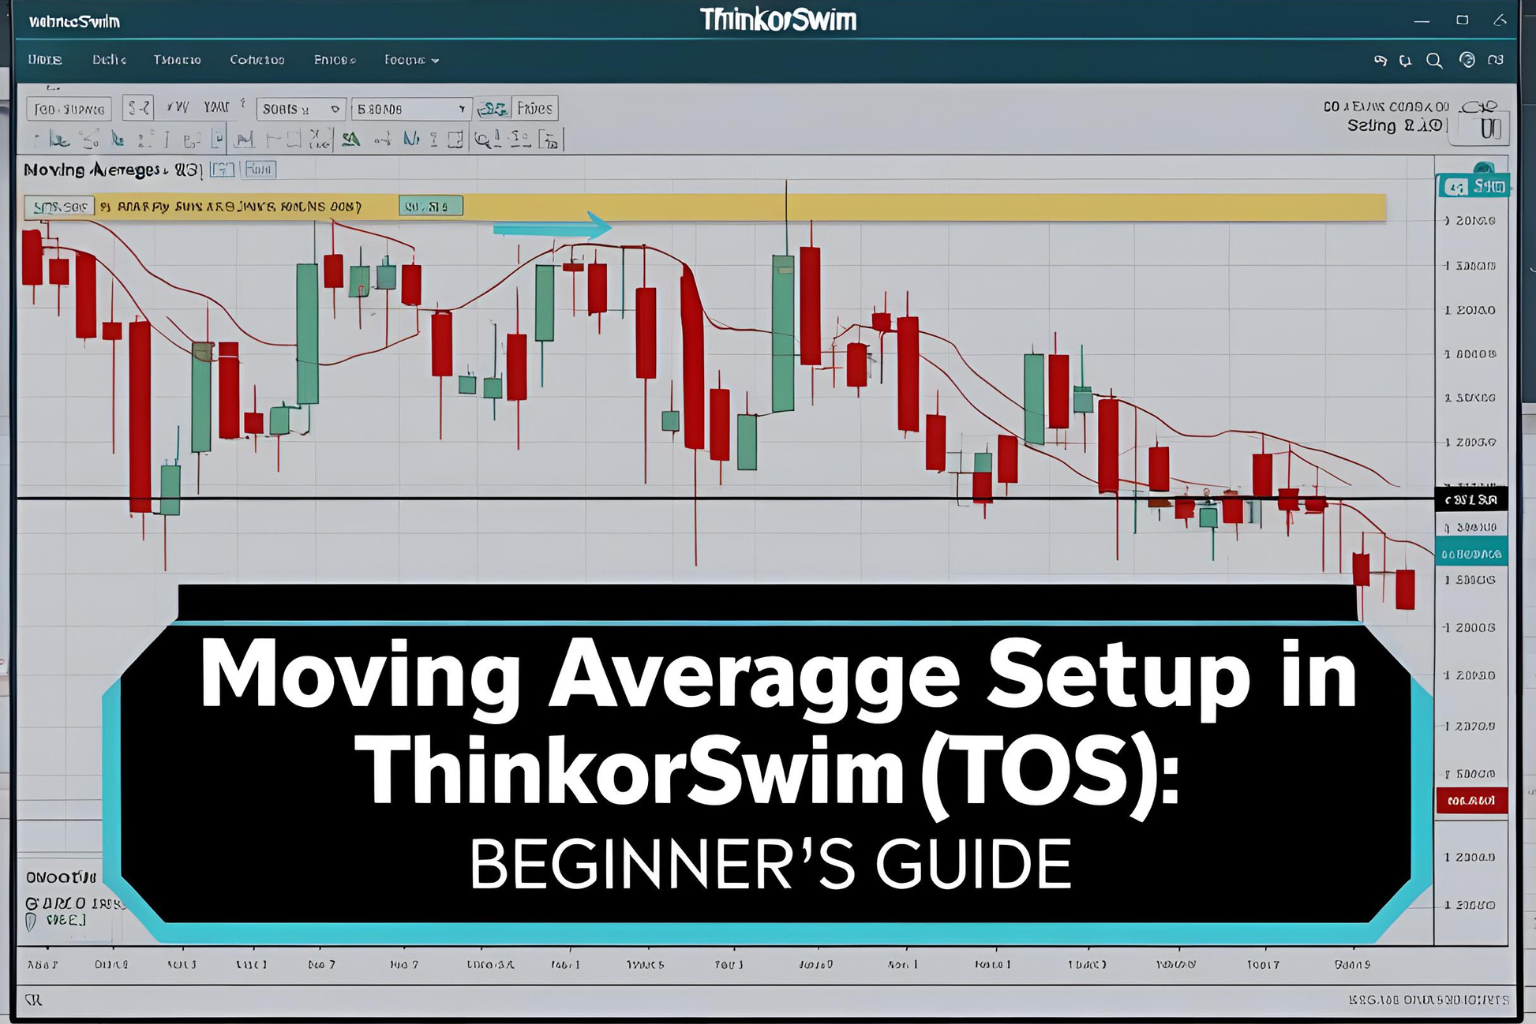
Moving Average Setup in ThinkorSwim (TOS): Beginner’s Guide
Introduction
ThinkorSwim (TOS) by TD Ameritrade is a powerful trading platform favored by serious traders for its advanced charting and customization options. If you’re using TOS and want to add moving averages to your charts, this guide will walk you through the entire setup.
We’ll show you how to configure SMA, EMA, and even create moving average crossovers using ThinkorSwim’s built-in tools.
Step 1: Open a Chart in ThinkorSwim
- Launch the ThinkorSwim desktop platform
- Click on the “Charts” tab at the top
- Select a symbol (e.g., AAPL, SPY, BTC/USD) from the top-left input box
- You’ll see a clean chart ready for indicator customization
Step 2: Add a Simple or Exponential Moving Average
- Click on the “Studies” button (top-right of the chart)
- Select “Edit Studies…” from the dropdown
- In the search bar, type:
- “SimpleMovingAvg” for SMA
- “ExpMovingAvg” for EMA
- Double-click to add it to the lower box
You can add multiple moving averages this way (e.g., 9 EMA, 21 EMA, 50 SMA, 200 SMA).
Step 3: Customize Moving Average Settings
In the “Edit Studies” window:
- Click the gear icon next to each MA
- Adjust:
- Length (e.g., 9, 20, 50, 200)
- Line color for easier visual separation
- Line style and thickness
- Hit “OK” when done, then “Apply”
Each moving average will now appear on your chart with your preferred settings.
Step 4: Add a Moving Average Crossover Study (Optional)
To automatically highlight crossover signals:
- Go to Edit Studies
- Search for “MovingAvgCross”
- Double-click to add it
- Customize:
- Fast length: e.g., 9
- Slow length: e.g., 21
- Choose your line styles and colors
- Click Apply and OK
This study will visually mark buy and sell signals when a crossover occurs.
Tips for Using Moving Averages in TOS
- Use 9 EMA + 21 EMA for fast crossover strategies
- Add 50 SMA and 200 SMA for long-term trend tracking
- Switch between timeframes (1-min to daily) to match your trading style
- Use drawing tools to mark support/resistance near MA levels
Best Practice Layouts
Here’s a suggested layout for trend traders:
- 9 EMA (blue), 21 EMA (orange), 50 SMA (green), 200 SMA (red)
- Timeframe: 15-minute for day trading, 1-hour for swing trading
- Include RSI or MACD for confirmation
Summary
Setting up moving averages in ThinkorSwim is simple once you know where to look. Whether you’re trading intraday trends or long-term positions, customizing SMA and EMA indicators on TOS allows you to create a clean, informative chart tailored to your strategy.
Take advantage of the MovingAvgCross study to save time and visually confirm key entry points.
FAQs
Can I save my moving average layout in TOS?
Yes. After setup, click “Style > Save style” to reuse it later.
Is there a way to alert me on MA crossovers?
Yes. Use Study Alerts to get notified when crossovers happen.
Do MAs adjust when I change the chart timeframe?
Yes. The MAs recalculate automatically based on the selected timeframe.
Can I use custom scripts for moving averages?
Yes. ThinkorSwim supports custom ThinkScript for advanced users.
What’s the best MA setup for beginners in TOS?
Start with a 9 EMA and 21 EMA for crossover signals and a 200 SMA for trend direction.