Hull Moving Average (HMA) Explained: A Faster, Smoother MA for Traders
Introduction
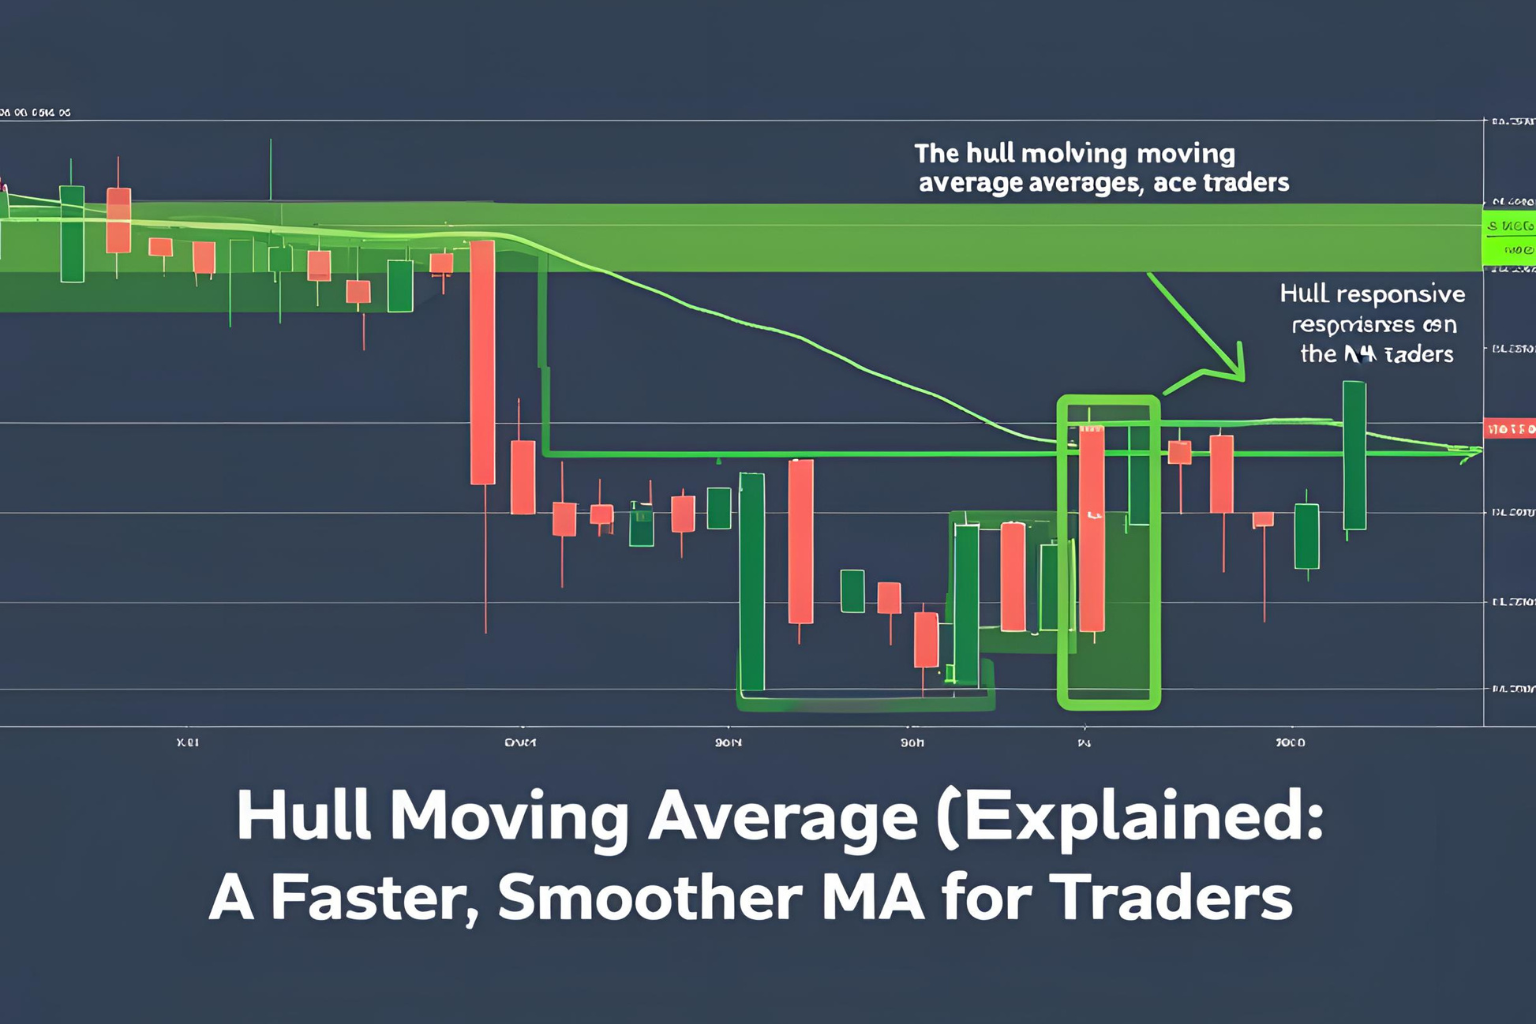
While traditional moving averages like the SMA and EMA are widely used, they often lag during rapid price movements. The Hull Moving Average (HMA) was developed to address this issue—offering traders a moving average that’s both responsive and smooth.
In this post, we’ll explain what the Hull Moving Average is, how it’s calculated, and how to use it in real-world trading scenarios across stocks, forex, and crypto.
What Is the Hull Moving Average (HMA)?
The Hull Moving Average (HMA) is a technical indicator designed by Alan Hull. It improves on the lag of other MAs by using a weighted moving average and a unique smoothing formula.
Key characteristics:
- Faster reaction to price changes than SMA or EMA
- Less lag, especially in trending markets
- Smoother curve, reducing noise and false signals
How the HMA Is Calculated (Simplified)
- Calculate a Weighted Moving Average (WMA) of half the period
- Double it
- Subtract the full-period WMA
- Apply a square root of the period to smooth it further
While most platforms handle this automatically, the formula results in a curve that responds quickly while filtering out market noise.
Best Settings for Hull MA
| Trading Style | Recommended HMA Period |
|---|---|
| Scalping / Intraday | 9 or 16 HMA |
| Swing Trading | 21 or 34 HMA |
| Trend Following | 55 or 100 HMA |
Choose the period based on your strategy and chart timeframe.
How to Use HMA in Trading
1. Trend Direction
- If HMA is sloping up → bullish trend
- If HMA is sloping down → bearish trend
- If HMA is flat → no clear direction
2. Entry Signal
- Buy when price crosses above the HMA line (especially if it turns upward)
- Sell or short when price crosses below the HMA (with downward slope)
3. Pullback Entry
- In a trend, wait for price to pull back to HMA and bounce
- Confirm entry with a bullish or bearish candle pattern
HMA vs Other Moving Averages
| Feature | SMA | EMA | HMA |
|---|---|---|---|
| Lag | High | Medium | Low |
| Responsiveness | Low | Medium | High |
| Smoothness | Medium | Low | High |
| Best For | Long-term | Short-term | Fast trend trading |
HMA is especially useful in high-volatility markets like crypto or fast-moving stocks.
Platforms That Support HMA
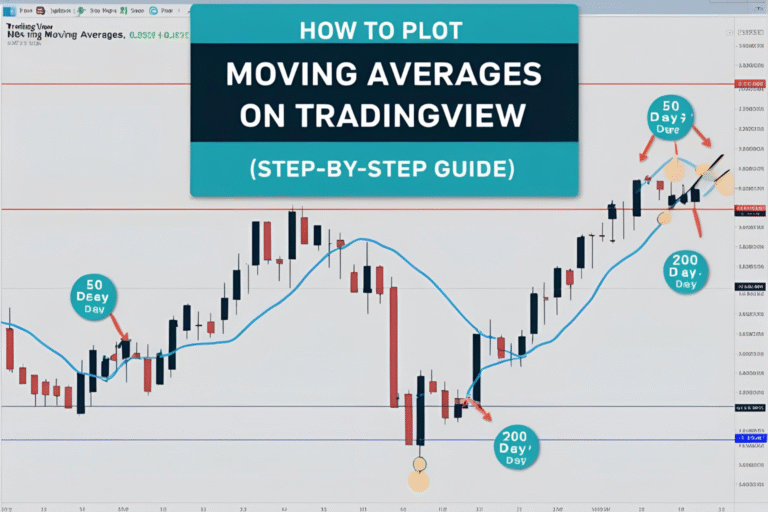
- TradingView: Built-in HMA indicator
- MetaTrader (MT4/MT5): Add via custom indicators
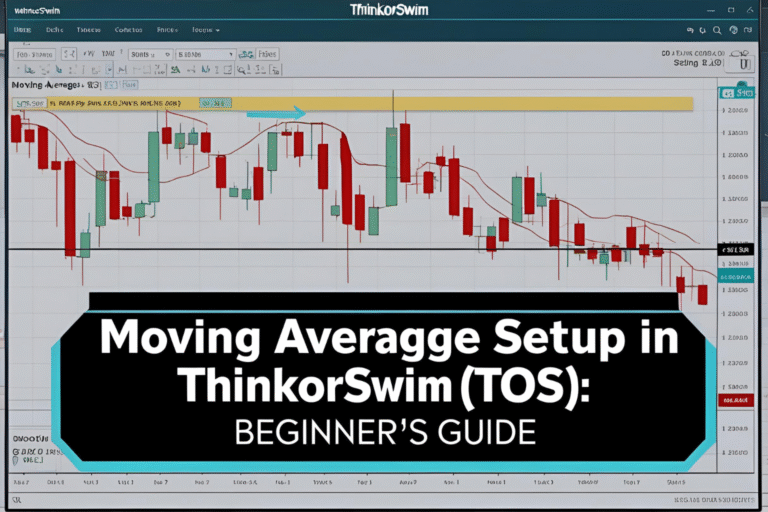
- ThinkorSwim: Available in the studies menu
- NinjaTrader & cTrader: Also support custom HMA overlays
Summary
The Hull Moving Average gives traders a unique edge by combining the speed of short-term MAs with the smoothness of long-term indicators. Whether you’re a day trader or swing trader, the HMA can help reduce lag, improve trend clarity, and enhance your technical setups.
If you’re tired of missing entries due to delayed signals, give HMA a try in your next chart analysis.
FAQs
Is the Hull MA better than EMA?
HMA is faster and smoother, but EMA is more widely used and supported by strategies.
Does HMA repaint?
No. The HMA does not repaint. It updates with each new candle close like other MAs.
Can I use HMA alone for signals?
It’s best combined with volume, RSI, or price action for confirmation.
What’s the best timeframe for using HMA?
HMA works on all timeframes, but it’s especially effective on 15-minute to daily charts.
Is HMA suitable for crypto and forex?
Yes. HMA is very popular in volatile markets like BTC/USD and EUR/USD.