What Is a Golden Cross in Trading? Simple Explanation & Examples
Introduction
In technical analysis, few chart patterns grab attention like the Golden Cross. It’s a widely recognized signal of a potential bullish trend and is especially popular among stock and crypto traders.
In this article, we’ll explain exactly what a Golden Cross in trading is, how it’s formed, and how to use it to time entries or confirm longer-term uptrends.
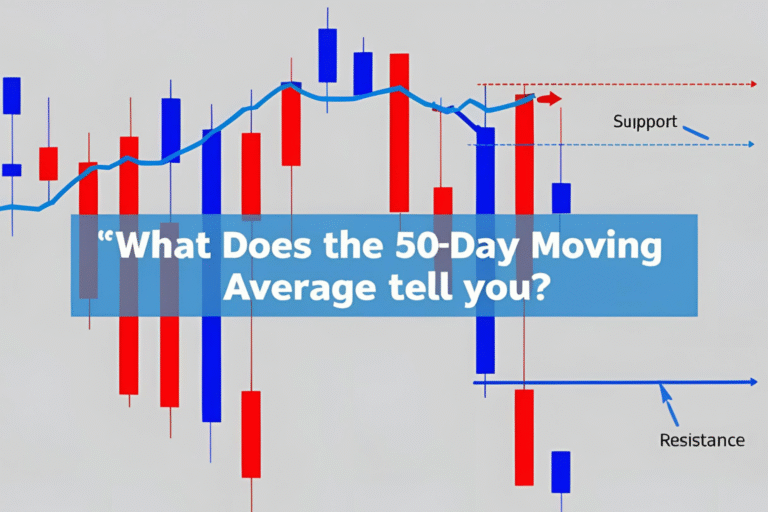
What Is a Golden Cross?
A Golden Cross occurs when a short-term moving average (usually the 50-day) crosses above a long-term moving average (typically the 200-day) on a price chart.
This crossover indicates that upward momentum is gaining strength and may lead to a sustained uptrend.
How It Works
Classic Golden Cross Setup:
- 50-day SMA crosses above the 200-day SMA
- Price is trending higher
- Volume is often increasing
- Acts as a bullish confirmation signal
Why It Matters
The Golden Cross is:
- Easy to spot
- Followed by institutions and algo trading systems
- Often leads to media attention and investor optimism
It’s considered one of the most reliable long-term trend indicators—especially on daily or weekly charts.
Real Example: Golden Cross on the S&P 500
In past bull markets, the S&P 500 Index formed Golden Crosses before major rallies. When the 50-day SMA crossed above the 200-day SMA in 2020, it marked the beginning of a strong recovery trend after the COVID market crash.
Timeframes for Spotting a Golden Cross
| Timeframe | Use Case |
|---|---|
| Daily | Long-term investing/swing trades |
| 4-Hour | Crypto or forex swing entries |
| Weekly | Position trades & macro trend shifts |
Shorter-term Golden Crosses (e.g. 9 EMA > 21 EMA) are used by intraday and scalping traders, but they’re more prone to false signals.
How to Trade the Golden Cross
Step-by-step strategy:
- Wait for the 50-day SMA to cross above the 200-day SMA
- Confirm with RSI > 50 or bullish price structure
- Enter on the first bullish pullback after the crossover
- Use stop-loss below the 200-day SMA or recent swing low
Optional: Use price action or volume spike as confirmation for stronger setups.
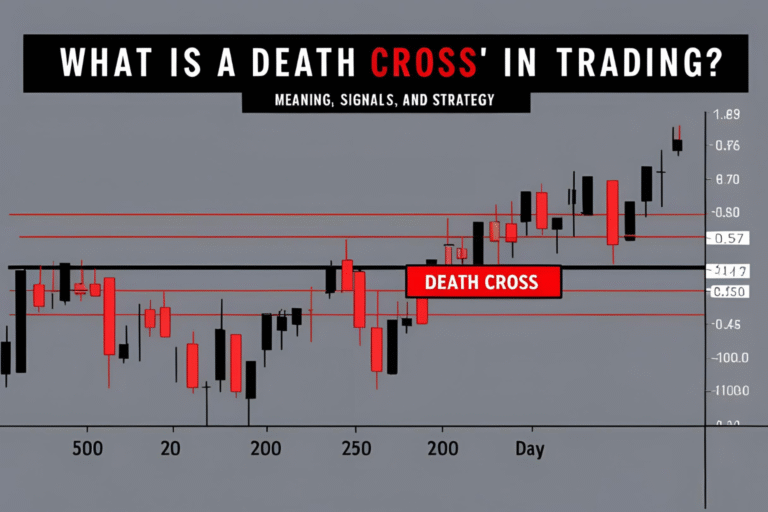
Golden Cross vs Death Cross
| Term | Signal Type | Moving Average Crossover |
|---|---|---|
| Golden Cross | Bullish | 50-day SMA crosses above 200-day SMA |
| Death Cross | Bearish | 50-day SMA crosses below 200-day SMA |
Both are trend-following signals—used to confirm sentiment, not predict tops or bottoms.
Summary
A Golden Cross in trading is a simple yet powerful signal that highlights when a market or stock may be entering a bullish phase. While not foolproof, it’s most effective when combined with volume, momentum indicators, and market context.
It’s a favorite of long-term investors, swing traders, and analysts looking for reliable confirmation of strength.
FAQs
Is the Golden Cross accurate?
It’s a reliable long-term trend indicator, but like any tool, it should be used with confirmation.
Can I use EMA instead of SMA for a Golden Cross?
Yes. Many traders use 50 EMA and 200 EMA for faster signals.
Does a Golden Cross work in crypto and forex?
Yes. It’s used widely in Bitcoin, Ethereum, and major currency pairs.
How often does a Golden Cross happen?
Rarely—maybe a few times per year per asset—making it more meaningful.
What’s the best chart timeframe to look for a Golden Cross?
The daily chart is most reliable for swing and long-term trades.