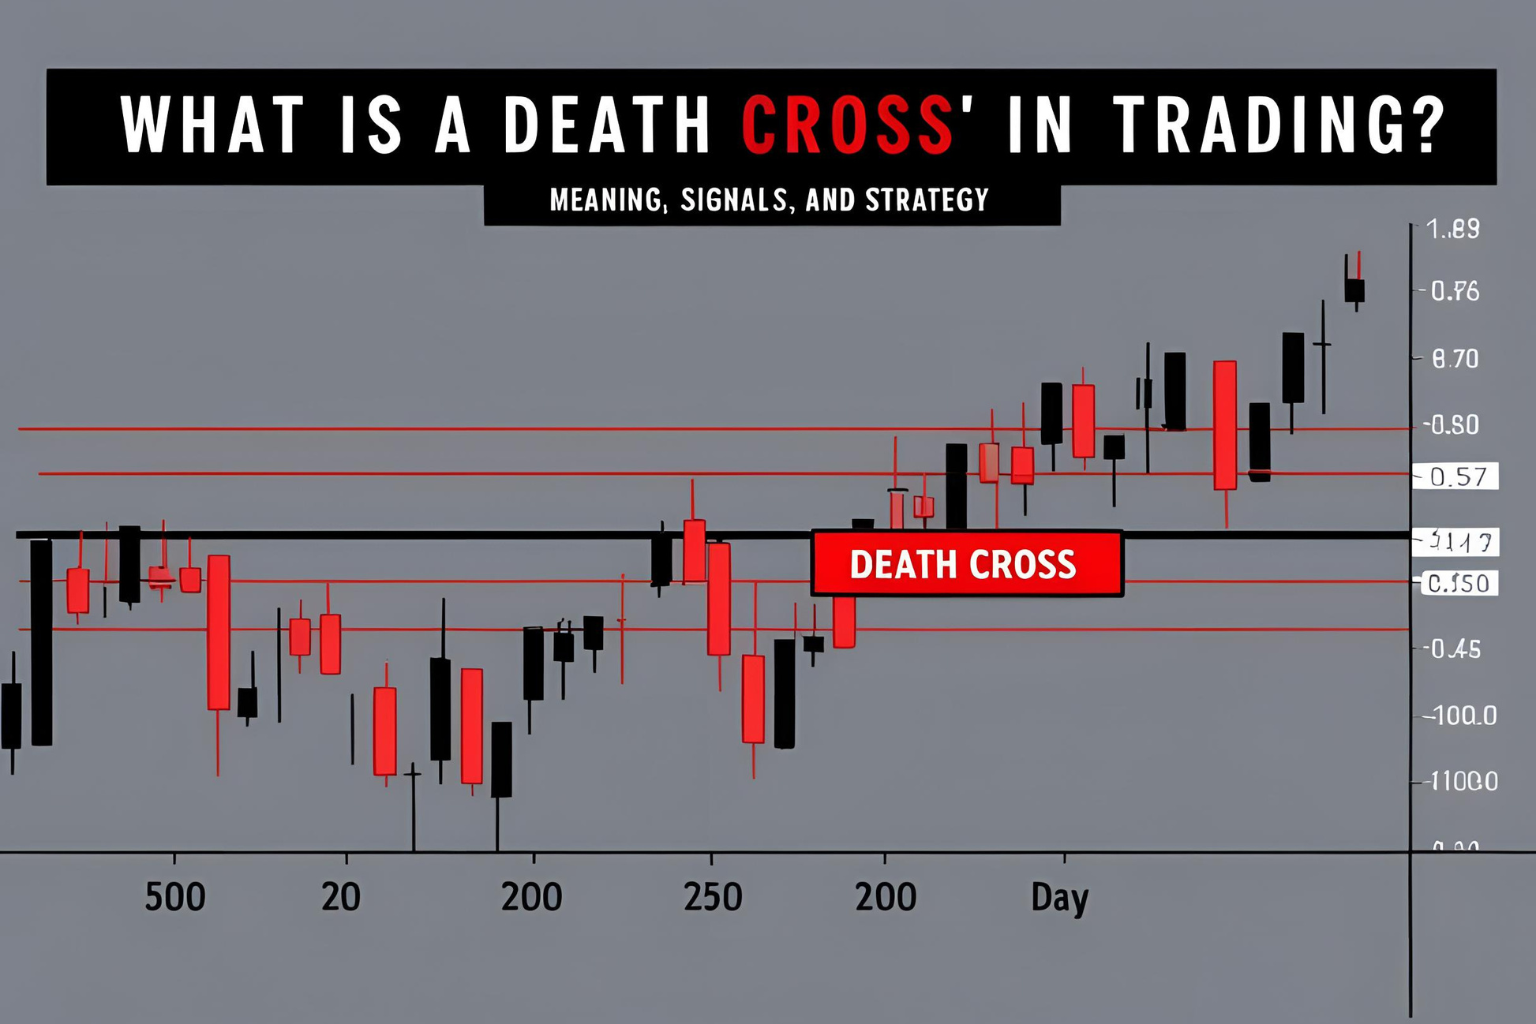
What Is a Death Cross in Trading? Meaning, Signals, and Strategy
Introduction
The Death Cross is a well-known bearish technical signal that often sparks fear among traders and investors. It indicates that a market or asset may be entering a prolonged downtrend—and is closely watched across stocks, crypto, and forex markets.
In this guide, we’ll explain what a Death Cross is in trading, how to identify it, and how to respond strategically.
What Is a Death Cross?
A Death Cross occurs when a short-term moving average, typically the 50-day SMA, crosses below a long-term moving average, typically the 200-day SMA.
This crossover suggests that downside momentum is increasing and a bearish phase could be underway.
How It Works
Classic Death Cross Setup:
- 50-day SMA drops below the 200-day SMA
- Price is generally in a downtrend
- Volume may spike as traders react
- Acts as a confirmation of weakness
Why It Matters
The Death Cross is considered significant because:
- It often precedes deeper corrections or bear markets
- Institutions and algos monitor it as a sell or risk-off signal
- It can lead to increased volatility and panic selling
Real Example: Bitcoin’s Death Cross
In May 2021, Bitcoin’s price dropped sharply after forming a Death Cross on the daily chart. The 50-day SMA crossed below the 200-day SMA, triggering increased bearish sentiment and a multi-week downtrend.
Timeframes Where the Death Cross Appears
| Timeframe | Use Case |
|---|---|
| Daily | Swing trades and trend shifts |
| Weekly | Long-term investor signals |
| 4-Hour | Short-term sentiment for crypto/forex |
It’s most reliable on the daily or weekly chart for major trend confirmation.
How to Trade the Death Cross
Strategy Steps:
- Identify the 50 SMA crossing below the 200 SMA
- Confirm with RSI < 50 or bearish chart structure
- Avoid new long positions unless there’s reversal evidence
- Consider short trades, hedging, or risk reduction
- Watch for a bounce toward the 200-day MA as resistance
Golden Cross vs Death Cross
| Term | Signal Type | MA Crossover Direction |
|---|---|---|
| Golden Cross | Bullish | 50 SMA crosses above 200 SMA |
| Death Cross | Bearish | 50 SMA crosses below 200 SMA |
Both are trend-following, long-term signals—not ideal for exact timing, but powerful confirmations.
Limitations of the Death Cross
- Lagging indicator: May appear after the trend has already begun
- False signals: Can fail in sideways or volatile markets
- Should be used with additional confirmation tools (RSI, volume, support zones)
Summary
The Death Cross in trading signals that bearish momentum is increasing and a potential downtrend has begun. While it’s not predictive on its own, it is a strong trend-confirming tool—especially on higher timeframes.
Used wisely, the Death Cross can help traders adjust risk, protect capital, and even find shorting opportunities.
FAQs
Is the Death Cross always bearish?
It signals bearish sentiment, but false signals are possible—especially in sideways markets.
Can I use EMA for a faster Death Cross signal?
Yes, many traders use the 50 EMA and 200 EMA for quicker signals.
Does it work in crypto and forex?
Yes, it’s widely used on Bitcoin, Ethereum, and major currency pairs.
What’s the best timeframe for spotting a Death Cross?
The daily chart is most reliable, while the weekly chart is used for longer-term investing.
Should I exit all positions when a Death Cross forms?
Not necessarily. Use it as a warning signal, not a sole reason to exit. Combine it with price action and broader trend analysis.