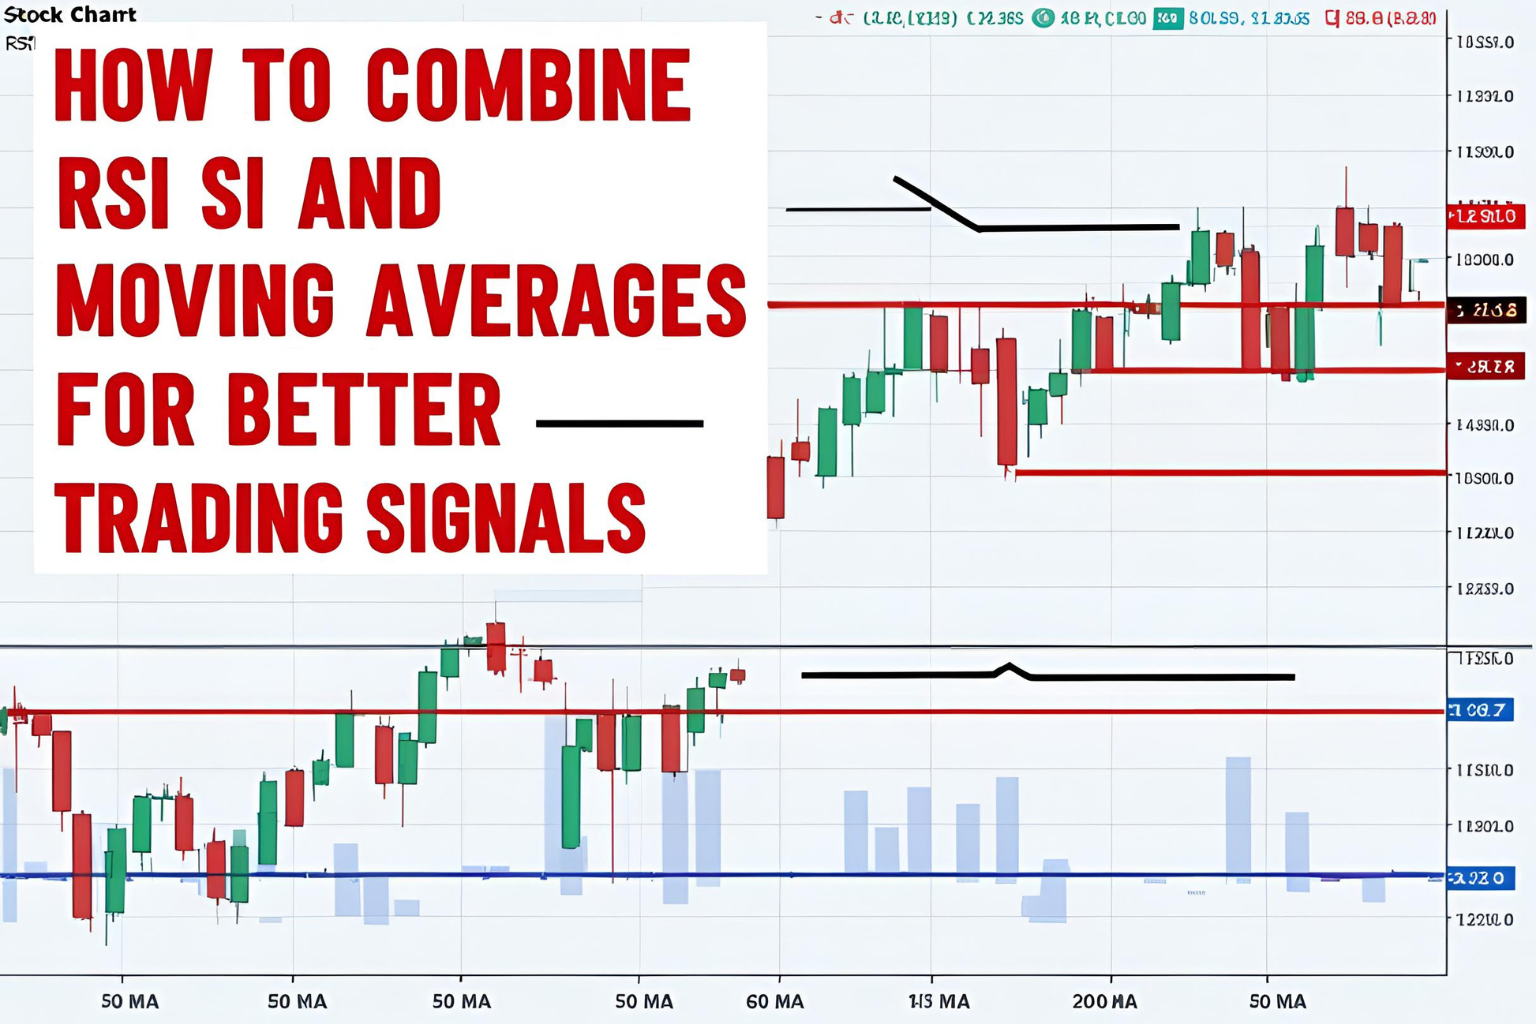
How to Combine RSI and Moving Averages for Better Trading Signals
Introduction
While moving averages help identify trends, they can sometimes generate false signals in choppy markets. That’s where the Relative Strength Index (RSI) comes in. When combined, these two tools offer a powerful way to confirm setups and increase your trading accuracy.
In this guide, we’ll show you how to combine RSI and moving averages in practical strategies for stocks, forex, crypto, and ETFs.
What Is the RSI?
The Relative Strength Index (RSI) is a momentum oscillator that measures the speed and change of price movements. It ranges from 0 to 100 and is typically used to identify overbought or oversold conditions.
- RSI > 70 = Overbought (possible reversal or pullback)
- RSI < 30 = Oversold (possible bounce or reversal)
RSI helps filter out low-probability trades by showing when price is stretched too far from its average.
Why Combine RSI with Moving Averages?
Moving averages are trend-following, while RSI is a momentum indicator. By combining the two:
- You confirm trend direction using MAs
- You confirm entry timing using RSI
- You reduce false signals during sideways price action
Strategy #1: RSI Confirmation on MA Crossover
Indicators:
- 9 EMA and 21 EMA (or 50 SMA for swing trades)
- RSI (14)
Buy Setup:
- 9 EMA crosses above 21 EMA (bullish crossover)
- RSI is above 50 but below 70 (strong, not overbought)
- Enter trade with stop-loss below the 21 EMA or recent low
Sell Setup:
- 9 EMA crosses below 21 EMA
- RSI is below 50 but above 30
- Enter short trade with stop above the 21 EMA or swing high
Strategy #2: RSI Divergence with Moving Average Support
Use this strategy to catch trend reversals:
- Price is above a 50 EMA (uptrend)
- RSI forms bearish divergence (price makes a new high, RSI doesn’t)
- Watch for bearish candle near moving average to confirm entry
In a downtrend:
- Price is below 50 EMA
- RSI forms bullish divergence
- Look for bullish confirmation before entering
Strategy #3: Oversold Bounce + MA Break
Use Case: When price is extremely oversold and starts reclaiming a short-term moving average
- RSI drops below 30 and then recovers
- Price breaks back above 20 EMA or 50 EMA
- Entry on the candle that closes above the MA with RSI > 30
This works well for quick mean-reversion trades, especially in intraday setups.
Tips for Effective Use
- Use RSI between 40–60 as a zone filter: Avoid trading during unclear momentum.
- Apply strategies on multiple timeframes for confirmation.
- Use RSI on close prices, not average or smoothed inputs.
- Avoid RSI signals during major news events—price may move irrationally.
Summary
Combining RSI and moving averages is a smart way to confirm trends, spot reversals, and reduce fakeouts. Whether you’re day trading or swing trading, this dual-indicator method improves signal quality and helps you time entries with more confidence.
FAQs
What RSI value works best with moving averages?
The standard 14-period RSI works well with 9 EMA, 21 EMA, or 50 SMA.
Should I buy when RSI is under 30 and price is above the MA?
That can signal a pullback in an uptrend, but wait for RSI to start moving upward and price to hold the MA.
Is this combo useful in crypto trading?
Yes. RSI and moving average combinations are very effective in high-volatility assets like BTC or ETH.
What timeframes work best?
15-min to 1-hour for intraday traders, daily for swing traders.
Does RSI confirm moving average crossovers?
Yes. If a bullish crossover happens and RSI is also above 50, the signal is stronger.