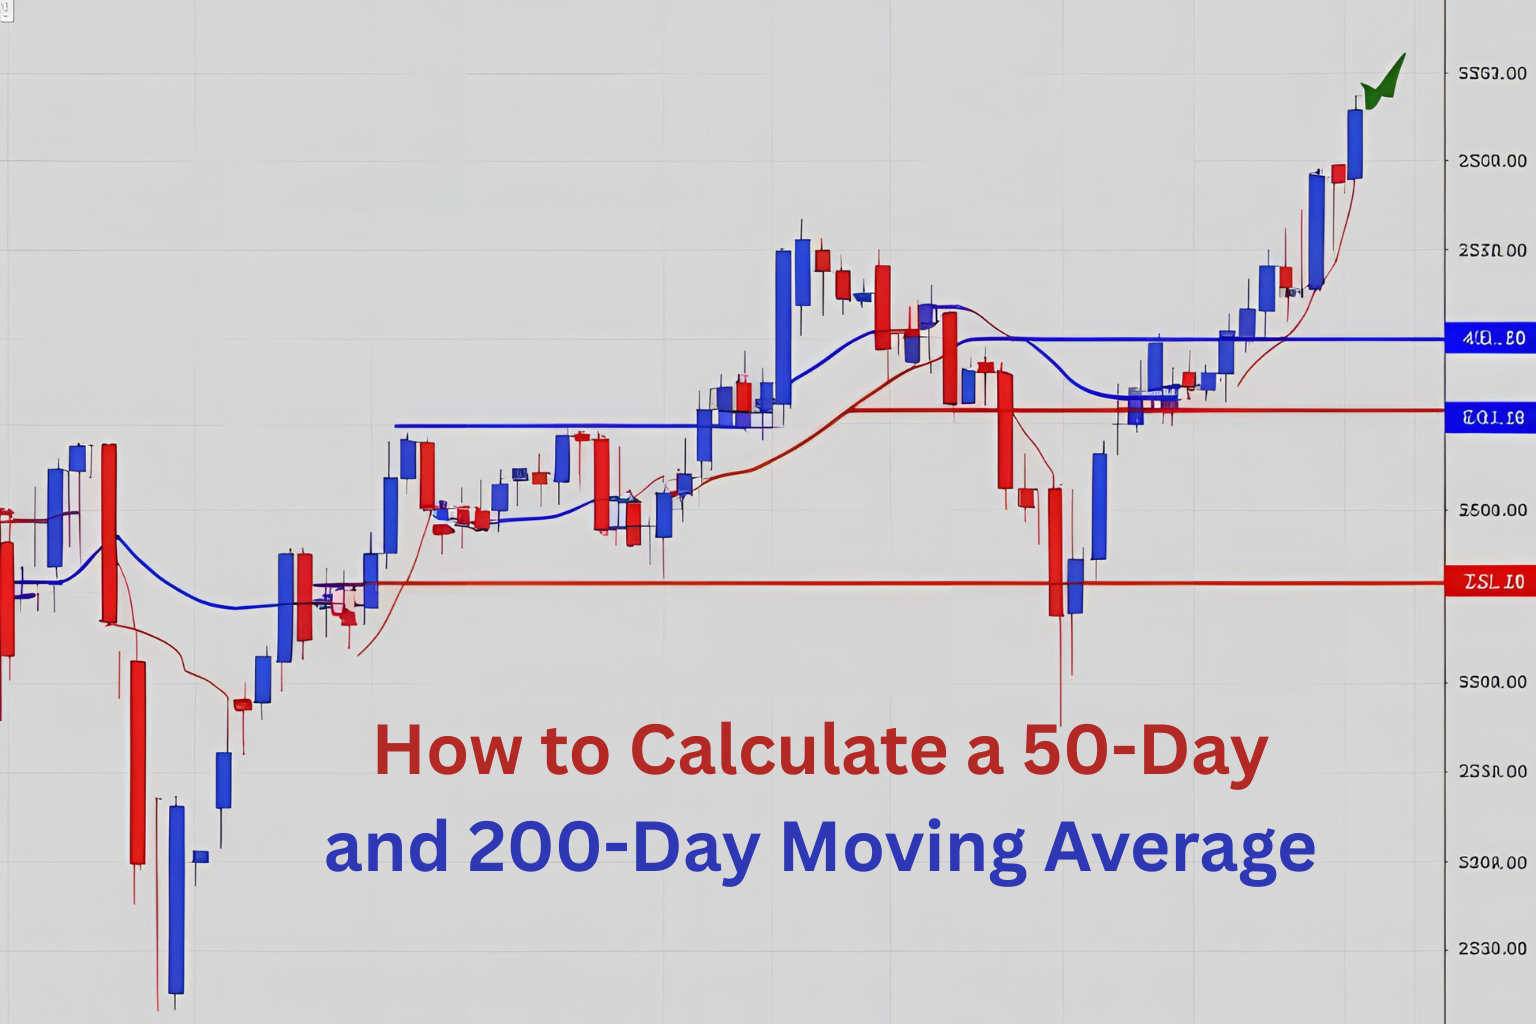
How to Calculate a 50-Day and 200-Day Moving Average
Introduction
The 50-day and 200-day moving averages are two of the most important technical indicators in trading. They are widely used by retail traders, institutional investors, and analysts to track long-term market trends and identify key support or resistance levels.
In this article, you’ll learn how to calculate both moving averages, how they differ, and how to use them in real-world trading.
What Is a Moving Average?
A moving average (MA) is a line plotted on a chart that shows the average price of an asset over a specific period. It smooths out short-term price noise and helps identify the overall direction of the trend.
The 50-day MA focuses on medium-term price action.
The 200-day MA is used for long-term trend analysis.
Formula for Simple Moving Average (SMA)
To calculate a Simple Moving Average (SMA): SMA=P1+P2+⋯+Pnn\text{SMA} = \frac{P_1 + P_2 + \dots + P_n}{n}SMA=nP1+P2+⋯+Pn
Where:
- PPP = closing price of each day
- nnn = number of periods (50 or 200)
How to Calculate the 50-Day SMA
- Collect the last 50 daily closing prices of a stock or asset.
- Add all 50 prices together.
- Divide the total by 50.
Example:
If the last 50 closing prices of a stock sum up to $7,500, then: 50-day SMA=7,50050=150\text{50-day SMA} = \frac{7,500}{50} = 15050-day SMA=507,500=150
This means the average price over the last 50 days is $150.
How to Calculate the 200-Day SMA
The process is the same as the 50-day SMA but with 200 days of data:
- Gather the last 200 closing prices.
- Add them together.
- Divide by 200.
Example:
If the total of 200 closing prices is $30,000, then: 200-day SMA=30,000200=150\text{200-day SMA} = \frac{30,000}{200} = 150200-day SMA=20030,000=150
Tools to Automate the Process
While you can calculate moving averages manually or in Excel, most traders use charting platforms like:
- TradingView – Add a 50-day or 200-day MA using the built-in MA indicator.
- ThinkorSwim – Plot custom moving averages with ease.
- MetaTrader – Apply MAs to any chart in seconds.
These platforms calculate moving averages in real time and let you customize colors, periods, and styles.
Why the 50-Day and 200-Day MA Matter
These two averages are considered institutional benchmarks. Here’s why they matter:
- Trend Confirmation: If price is above the 50-day or 200-day MA, it indicates an uptrend.
- Support & Resistance: Prices often bounce off these levels.
- Golden Cross / Death Cross: A 50-day crossing above the 200-day is bullish (Golden Cross). The opposite is bearish (Death Cross).
How Traders Use Them
- Swing traders use the 50-day MA to spot entries and exits.
- Long-term investors monitor the 200-day MA for market cycles.
- Analysts use these MAs to determine general market health (e.g., S&P 500 trend).
Summary
The 50-day and 200-day moving averages are simple to calculate but powerful in practice. Whether you trade stocks, crypto, or ETFs, understanding these averages can help you make informed decisions and stay on the right side of the trend.
FAQs
Can I use these moving averages for crypto and forex?
Yes, both are commonly used in all markets, including BTC/USD and EUR/USD charts.
What timeframes work best with 50-day and 200-day MAs?
They are best applied on daily charts for medium- and long-term analysis.
What’s the difference between 50-day and 200-day MA signals?
The 50-day is more responsive, while the 200-day reflects broader trends.
How often should I update the average?
Daily. Most platforms auto-update moving averages with each new candle.
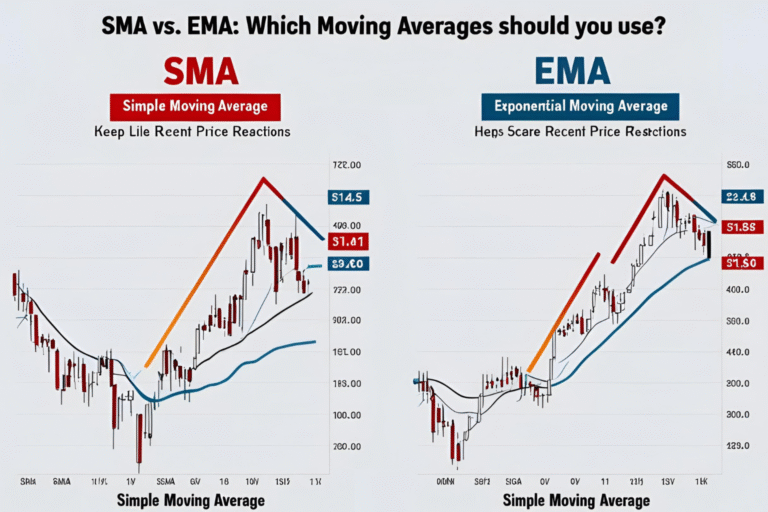
Can I use EMA instead of SMA for these periods?
Yes, but EMA reacts faster. Many traders prefer SMA for long-term signals.