Moving Average in Technical Analysis: Common FAQs Answered
Introduction
Moving averages are among the most frequently used tools in technical analysis. They help smooth price data, identify trends, and support decision-making for traders across all asset classes.
But if you’re just starting out, you probably have questions like:
Which MA should I use? What timeframe is best? Are crossovers reliable?
This post answers the most common FAQs about moving averages in technical analysis, helping you use them with more clarity and confidence.
What Is a Moving Average in Technical Analysis?
A moving average (MA) is a calculation that tracks the average price of an asset over a set number of periods.
It’s used to:
- Identify trend direction
- Filter market noise
- Act as dynamic support or resistance
- Trigger trade entries through crossovers
Frequently Asked Questions
1. Which type of moving average is better—SMA or EMA?
- SMA (Simple Moving Average): Best for long-term, smoother signals
- EMA (Exponential Moving Average): More responsive; great for short-term trading
Use EMA for faster markets like crypto or intraday forex, and SMA for long-term trend confirmation.
2. What is the best moving average period for beginners?
- Start with 20, 50, and 200
- 20 MA → short-term
- 50 MA → medium-term
- 200 MA → long-term
These are widely used and respected by professionals and institutions.
3. Do moving average crossovers really work?
They can—but mostly in trending markets.
- A bullish crossover (e.g., 9 EMA > 21 EMA) may signal an entry
- A bearish crossover suggests a trend reversal or exit point
Always confirm with price action or indicators like RSI or MACD.
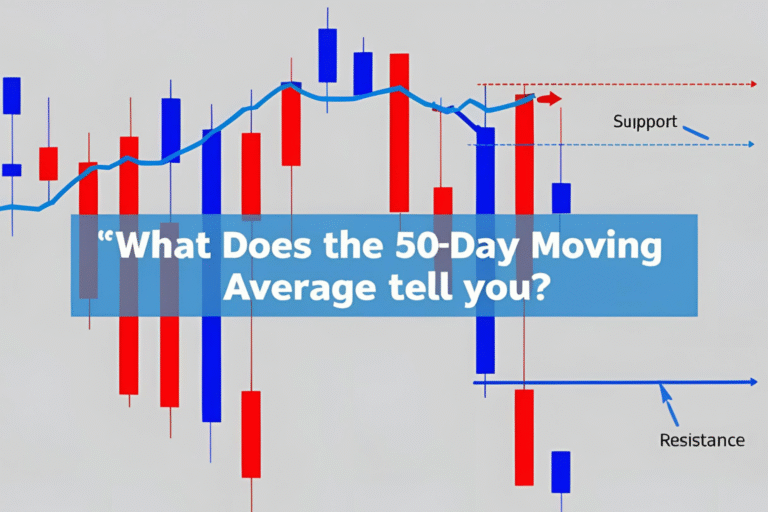
4. Can moving averages act as support and resistance?
Yes. In trending markets:
- Price often bounces off the MA (especially 20 or 50 EMA)
- A break below an MA can signal a shift in sentiment
Many traders buy on pullbacks to a rising MA or sell at retests in a downtrend.
5. What are the limitations of using moving averages?
- Lagging indicator: MAs are based on past data
- False signals in sideways or choppy markets
- Not predictive: Best used as a confirmation tool, not for forecasting tops or bottoms
That’s why moving averages are typically combined with momentum indicators or volume analysis.
Bonus: Quick Reference Table
| MA Type | Best Use | Strength | Weakness |
|---|---|---|---|
| SMA | Long-term trends | Smooth signals | Slower to react |
| EMA | Short-term trading | Fast reaction to price | More false signals in chop |
| HMA | Fast trend trading | Low lag, high smoothness | Not widely supported |
Summary
Moving averages are foundational in technical analysis for good reason—they help traders stay on the right side of the trend.
Whether you’re using a simple 50-day SMA or an EMA crossover strategy, the key is understanding how each type works and when it’s most effective.
Start with the basics, test strategies on charts, and always combine moving averages with other tools for better decisions.
FAQs Recap
Can I trade using moving averages alone?
You can, but results improve when combined with other indicators or chart patterns.
What’s the most popular moving average?
The 50-day and 200-day SMAs are the most watched across markets.
Should beginners use SMA or EMA?
Beginners may start with SMA for simplicity, then move to EMA for quicker entries.
Do professionals use moving averages?
Yes. Hedge funds, institutions, and algo systems use MAs as part of broader models.
Can I use moving averages in all markets?
Absolutely. They apply to stocks, forex, crypto, ETFs, commodities, and indices.