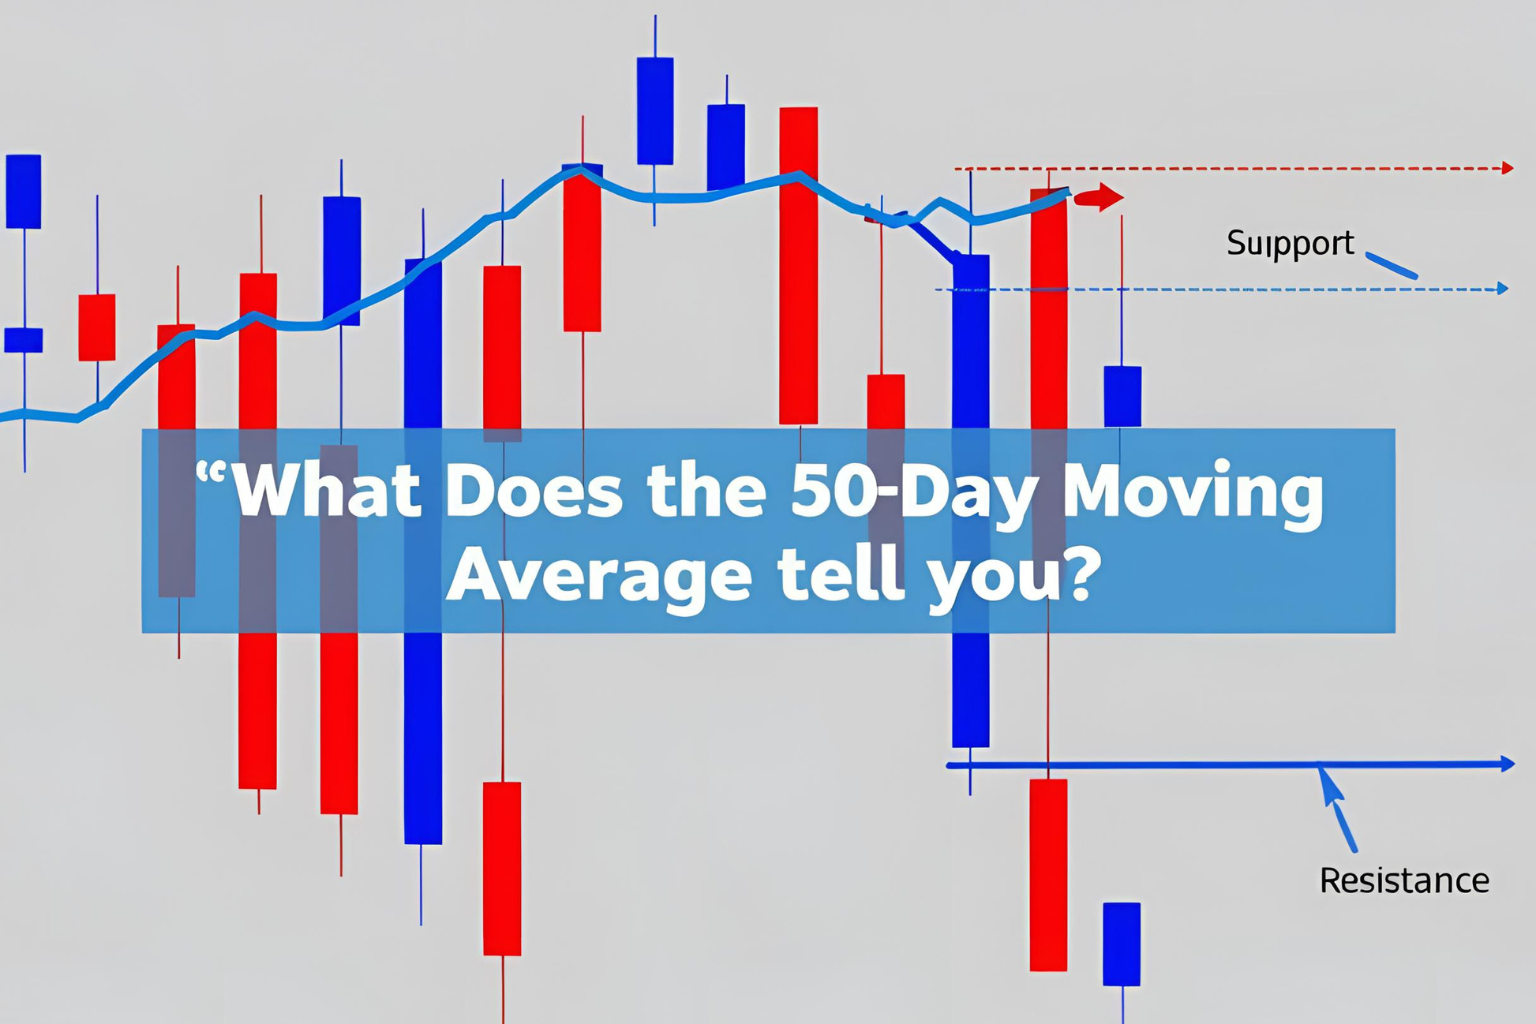
What Does the 50-Day Moving Average Tell You? Explained Simply
Introduction
The 50-day moving average (50 SMA) is one of the most widely followed indicators in technical analysis. Used by both retail and institutional traders, it offers a clear view of medium-term price trends and potential entry or exit zones.
In this article, we’ll break down exactly what the 50-day moving average tells you, why it matters, and how to use it in stocks, forex, and crypto trading.
What Is the 50-Day Moving Average?
The 50-day moving average is a simple average of an asset’s closing prices over the last 50 trading days. It smooths out short-term volatility and highlights the intermediate trend.
Traders plot it on a chart to:
- Identify the current direction of momentum
- Spot pullback zones
- Define bullish or bearish market conditions
Key Signals from the 50-Day MA
1. Trend Direction
- Price above the 50 SMA: Bullish bias
- Price below the 50 SMA: Bearish bias
2. Dynamic Support or Resistance
- In an uptrend, the 50-day MA often acts as support
- In a downtrend, it can act as resistance
3. Trend Reversal Warning
- A break below the 50-day MA after an uptrend may signal weakening momentum
- A breakout above the 50-day MA could suggest a trend change
Example in Stocks: Apple (AAPL)
- AAPL often finds support at its 50-day MA during bullish cycles
- When price breaks below the 50 SMA with volume, it often triggers profit-taking or short-term corrections
- Institutions closely monitor this level for re-entry or risk management
Why Traders Love the 50-Day MA
- Not too fast, not too slow: Strikes a balance between short- and long-term signals
- Widely respected: Used by hedge funds, portfolio managers, and algorithms
- Works on all timeframes: Especially powerful on daily charts
When the 50 SMA Is Most Useful
- During pullbacks in an uptrend
- As a trailing support in swing trades
- In moving average crossover strategies (e.g., 50/200 Golden Cross)
- To determine if an asset is above or below fair value
Limitations to Be Aware Of
- It’s a lagging indicator—based on past data
- Not effective in sideways or choppy markets
- Can give false signals without volume or price action confirmation
Summary
The 50-day moving average tells you the medium-term trend direction, helps you find support/resistance zones, and provides context for momentum. It’s a favorite among traders for its simplicity and effectiveness, especially when combined with volume or other indicators.
FAQs
Is the 50-day MA good for day trading?
It’s better suited for swing and position trading. For day trading, use shorter EMAs like 9 or 20.
What happens when price breaks the 50-day MA?
It may indicate a trend reversal, especially with volume confirmation.
Can I use the 50-day MA in forex and crypto?
Yes, it works across all markets and timeframes.
What’s the difference between 50 EMA and 50 SMA?
The EMA reacts faster to price changes, while the SMA is smoother.
How reliable is the 50-day moving average?
It’s widely used and effective in trending markets but should be confirmed with other tools.