Golden Cross and Death Cross: Moving Average Signals Explained
Introduction
In technical analysis, two of the most talked-about signals are the Golden Cross and the Death Cross. These powerful moving average crossover signals can help traders and investors anticipate major market trends—both bullish and bearish.
In this guide, we’ll explain what these signals mean, how to spot them, and how to use them effectively in your trading strategy.
What Is a Golden Cross?
A Golden Cross occurs when a short-term moving average (typically the 50-day) crosses above a long-term moving average (typically the 200-day).
This is considered a bullish signal, indicating that a strong uptrend may be starting.
Key features:
- Price is rising steadily.
- 50-day MA moves above 200-day MA.
- Seen as a long-term buy signal.
Example:
If Apple’s 50-day moving average rises above its 200-day moving average on the daily chart, this could trigger institutional buying and signal long-term bullish momentum.
What Is a Death Cross?
A Death Cross occurs when the 50-day moving average crosses below the 200-day moving average.
This is viewed as a bearish signal, suggesting that a major downtrend may be underway.
Key features:
- Price is declining.
- 50-day MA drops below 200-day MA.
- Often used as a long-term sell or short signal.
Example:
When the S&P 500 forms a Death Cross, it often reflects broader market weakness and risk-off sentiment.
Why These Crosses Matter
Both the Golden Cross and Death Cross are widely followed by:
- Institutional investors
- Algo-trading bots
- Retail traders
They often lead to increased volume and volatility after the crossover is confirmed.
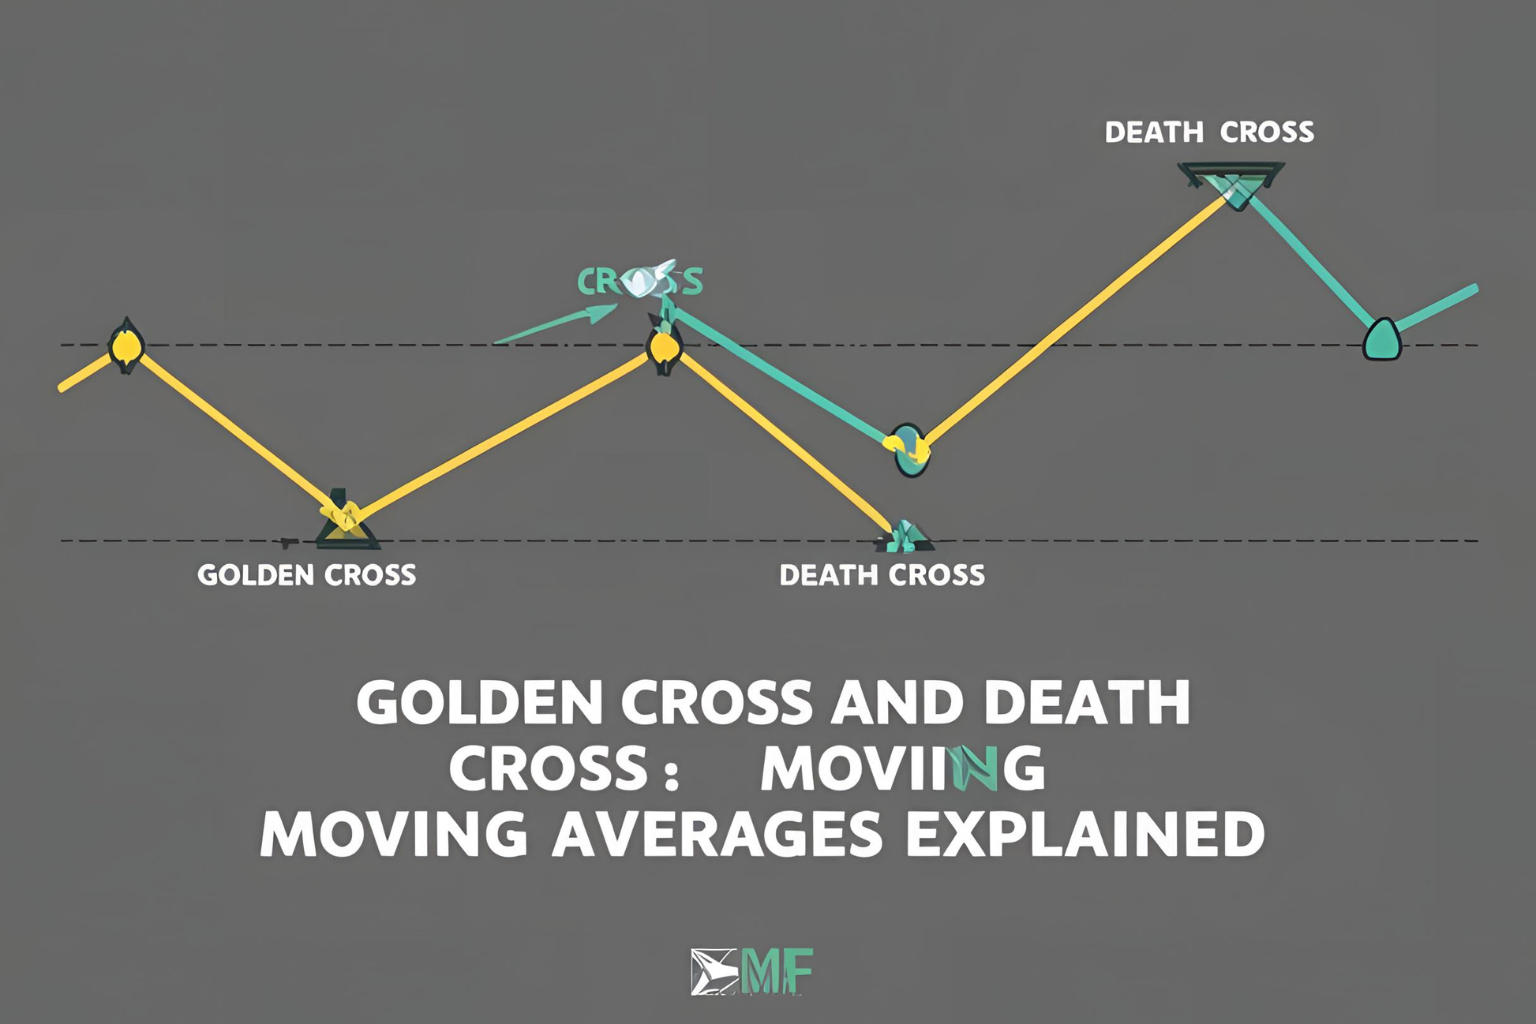
Chart Example (Conceptual Description)
Imagine a daily stock chart with:
- A blue 50-day moving average line curving upward.
- A red 200-day moving average line sloping slightly downward.
- The moment the blue line crosses above the red one is the Golden Cross.
For a Death Cross, reverse the direction of the crossover.
Best Timeframes to Use
- Daily Chart: Most reliable for long-term trend shifts.
- Hourly or 4H Charts: Can be used in crypto and forex for short-term trades.
- Weekly Charts: Sometimes used by long-term investors.
How to Trade the Golden Cross and Death Cross
Golden Cross Strategy:
- Wait for the crossover on the daily chart.
- Confirm with volume or momentum indicators (e.g., RSI, MACD).
- Consider entering long positions or increasing exposure.
Death Cross Strategy:
- Watch for the 50-day dropping below the 200-day MA.
- Confirm with bearish candlestick patterns or declining volume.
- Reduce risk exposure or consider short trades.
Golden Cross and Death Cross in Crypto
These signals are especially popular in Bitcoin and Ethereum analysis. For example:
- A Golden Cross on BTC/USD often leads to massive rallies.
- A Death Cross may precede sharp corrections.
However, crypto markets are more volatile, so confirm signals with other indicators.
Caution: Don’t Use in Isolation
While powerful, these signals are lagging indicators—they occur after a trend has already begun.
Tips:
- Combine with price action, volume, or MACD.
- Watch for false signals in sideways markets.
- Always set risk management rules.
Summary
The Golden Cross and Death Cross are classic moving average crossover signals that reveal long-term trend shifts. While not perfect, they are widely trusted tools that can improve your trading decisions—especially when confirmed with other indicators.
FAQs
Is the Golden Cross always a buy signal?
It is a bullish signal, but confirmation with other tools is advised before trading.
Can Death Cross predict a market crash?
Not always. It signals weakness but doesn’t guarantee a crash. Use other indicators for context.
How long does a Golden Cross trend last?
It varies. Some trends last weeks or months, depending on the asset and market condition.
Can these signals be used for intraday trading?
They’re more effective on higher timeframes but can be adapted for shorter-term charts.
Which markets do these signals work best in?
U.S. stocks, ETFs, crypto (like BTC), and major forex pairs.