200-Day Moving Average Strategy for U.S. Equities Explained
Introduction
The 200-day moving average (200 SMA) is one of the most respected technical indicators in the stock market. Institutional investors, hedge funds, and retail traders all use it to gauge the long-term health of a stock.
In this guide, you’ll learn how to use the 200-day moving average strategy on U.S. equities to identify trends, manage entries and exits, and avoid costly mistakes.
What Is the 200-Day Moving Average?
The 200-day SMA calculates the average closing price of a stock over the last 200 trading days. It creates a smooth line on a chart that shows the stock’s long-term direction.
Key Points:
- A stock trading above the 200-day MA is typically in a long-term uptrend.
- A stock trading below the 200-day MA may be in a downtrend or under pressure.
- The 200-day MA acts as dynamic support or resistance.
Why It Matters in U.S. Equities
Many U.S. stocks on the NYSE and Nasdaq are followed closely with this indicator. When a stock reclaims or breaks below its 200-day MA, it often draws media headlines and triggers institutional trading decisions.
Traders watch this level to:
- Confirm trend direction
- Time entries after breakouts
- Spot breakdowns and reversals
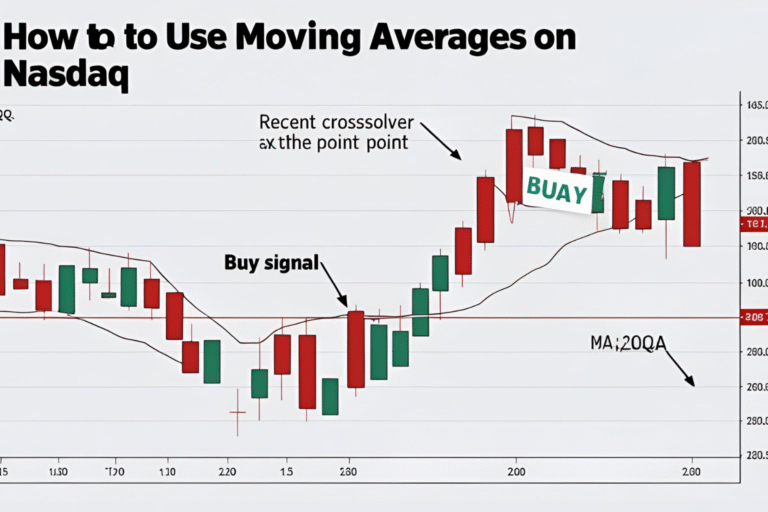
Strategy Setup: Buy Above the 200-Day MA
Setup Steps:
- Screen for U.S. stocks trading above the 200-day SMA on daily charts.
- Confirm with strong volume and bullish candlestick formations.
- Enter on a pullback that holds above the 200-day line.
- Set stop-loss slightly below the moving average or recent swing low.
This strategy favors:
- Strong growth stocks
- Trend continuation trades
- Swing or position trades
Strategy Setup: Short Below the 200-Day MA
Setup Steps:
- Identify stocks trending below the 200-day SMA.
- Look for rallies that fail near the 200-day (acting as resistance).
- Enter short on rejection candles or bearish reversal patterns.
- Stop-loss just above the 200-day or recent highs.
This strategy is effective during bear markets or sector rotations.
Bonus: 50/200-Day MA Crossover
The Golden Cross and Death Cross strategies also involve the 200-day MA:
- Golden Cross: 50-day MA crosses above 200-day → Bullish
- Death Cross: 50-day MA crosses below 200-day → Bearish
These signals can act as longer-term confirmation of a trend reversal.
Pros and Cons of the 200-Day MA Strategy
Pros:
- Filters out short-term market noise
- Widely respected by professional traders
- Clear trend confirmation
Cons:
- Lags behind fast price changes
- Not effective in sideways or range-bound markets
- Needs confirmation from volume or price action
Example: 200-Day MA on Apple (AAPL)
In past rallies, Apple often held above its 200-day MA, using it as a springboard for further gains. During corrections, the 200-day acted as key support, and a break below often led to deeper pullbacks.
Summary
The 200-day moving average strategy is a cornerstone of technical analysis in the U.S. stock market. It helps filter out short-term noise, identify long-term trends, and guide entry and exit decisions. Whether you’re trading tech giants or small caps, this indicator can anchor your strategy.
FAQs
Is the 200-day MA suitable for day trading?
Not really. It’s a long-term trend indicator, better suited for swing and position trading.
Can I use the 200-day EMA instead of SMA?
You can, but the SMA is more commonly used by institutions for this timeframe.
What sectors respond best to this strategy?
Tech, finance, energy, and large-cap growth stocks.
Should I combine it with other indicators?
Yes. Use RSI, volume, or candlestick patterns to confirm the signal.
How often should I check it?
Once per day on the daily chart is sufficient.